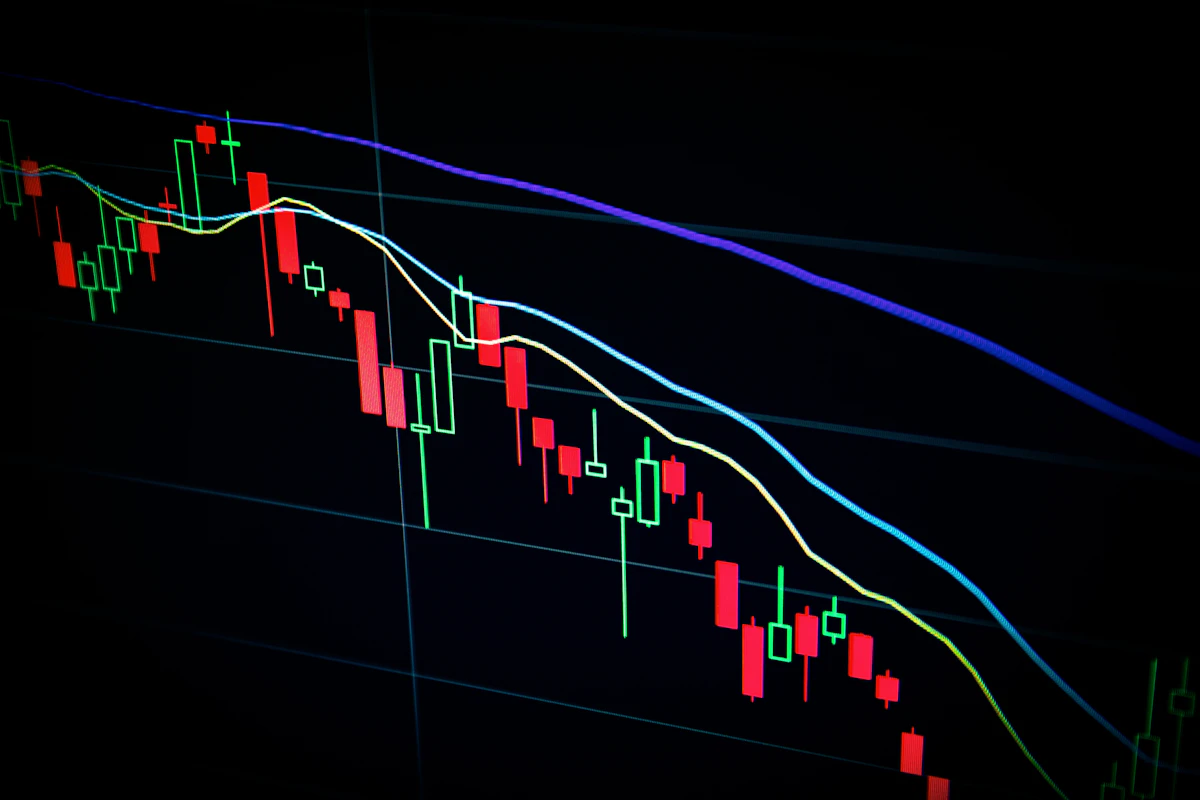
Market volatility is the size of an instrument's price swings over a given period, usually measured as the average true range or the standard deviation of returns. It matters because it sets the distance a stop needs, the size a position can be, and the odds that a level holds. Volatility is neither good nor bad for a trader. It is a condition to be measured first and traded second. This article explains how to measure it, how to recognise when it has changed regime, and how to adjust sizing, stops and expectations while it lasts.
What Does Volatility Actually Measure?
Two numbers cover most of what a trader needs. The average true range (ATR) is the mean of the last N bars' ranges, with gaps included, and it answers a practical question: how far does this instrument travel in one bar on a normal day? A 14-period ATR on the daily chart of EUR/USD near 60 pips means a stop 20 pips away sits inside ordinary noise. The second number is realized volatility, the standard deviation of returns over a window, quoted as an annualised percentage. It compares instruments on the same scale, so a trader can see that a crypto asset at 70% and an index CFD at 15% cannot be sized the same way.
Both numbers are backward-looking. They describe the last few weeks, and the market has no obligation to keep behaving that way. That is why the next question matters more than the level itself.
How Do You Know the Regime Has Changed?
Volatility clusters. Quiet days follow quiet days and violent days follow violent days, and the transitions between the two states are where most damage is done. A trader sized for a 60-pip day who meets a 180-pip day has tripled their risk without changing a single setting. Three signs that the regime has shifted are worth checking every session:
- ATR rising faster than price. A 20-day ATR that has risen 40% while price is still inside its range means the bars are getting longer without going anywhere. Breakouts from that condition tend to travel.
- Overnight gaps appearing where there were none. On forex and index CFDs, gaps at the session open are a sign that the news flow has started to lead price.
- Correlations converging. When gold, the yen and the Swiss franc start moving together, the market is trading one variable, usually risk appetite, and every position in the book is the same trade.
Statistical regime models formalise this. A hidden Markov model classifies each bar as belonging to a calm or a turbulent state and reports the probability of a switch, and HAR-RV models separate daily, weekly and monthly volatility so that a one-day spike is not mistaken for a new regime. AlphaMind's Multi-Model Framework runs both as feature streams, and the regime detection guide covers how the output is read on a chart.
How Should Position Size Change?
The cleanest rule is to size by risk rather than by lots. Decide the amount of account equity one trade may lose, place the stop where the trade idea is wrong, and let the volatility set the lot size. If the stop must be twice as far because ATR has doubled, the position is half as large, and the money at risk is unchanged. The position size calculator does the arithmetic from account balance, risk percentage and stop distance.
Two refinements help in the turbulent state. First, cut the risk percentage itself, not only the lot size. A trader who risks 1% in calm markets and 0.5% in a high-volatility regime survives the string of losses that a regime change usually brings. Second, count correlated positions as one. Long gold, long AUD/USD and short USD/JPY in a risk-off week is one position three times over.
Where Do Stops Go When the Range Expands?
A stop placed at a fixed pip distance stops working the day volatility changes. Placing it at a multiple of ATR, commonly 1.5 to 2 times the current 14-period value beyond the entry level, keeps it outside ordinary noise in both regimes. Wider stops mean smaller positions, which is the point. A trader who keeps the same size and widens the stop has doubled the risk.
Targets scale the same way. A 2-to-1 reward-to-risk target that was 40 pips away in a calm market is 100 pips away in a volatile one, and it may be reached in an hour rather than a day. The risk-reward calculator shows the win rate a given ratio needs to break even, which is the number that decides whether the trade is worth taking at all.
When Is Standing Aside the Right Trade?
Some volatility is scheduled. Central bank decisions, CPI and non-farm payrolls widen spreads and thin liquidity for minutes at a time, and a stop can be filled far from its price. The economic calendar lists the releases by impact, and a rule of no new positions in the fifteen minutes around a high-impact print costs very little in missed opportunity. Unscheduled volatility, a bank failure or a geopolitical shock, has no calendar entry. The signs above, especially converging correlations, are the early warning, and reducing size before the picture is clear is cheaper than reducing it after.
How Does AlphaMind Read Volatility?
Every read from the AI Trend Analysis page carries the current regime, the forecast path as a band rather than a single line, and the price at which the read is wrong. The width of the band is the model's own estimate of volatility ahead, so a trader sees the sizing problem before placing the order rather than after. Signals published on the AI Signals page carry their invalidation level for the same reason.
Volatility rewards the trader who measures it and punishes the one who guesses. Measure the range, size to the range, place stops outside the range, and treat a change of regime as a change of rules rather than a run of bad luck.
This article is educational content and does not constitute investment advice. Trading involves risk of loss. Any forecast, signal or volatility estimate should be used to build understanding rather than to guarantee future results.

